
U.S. MANUFACTURING DECISION TOOLS
Manufacturing location investment decisions are a delicate balancing act between customer, economic, demographic, infrastructure, and investment criteria. The optimal location is close to key customers, but also offers favorable conditions for remaining a strategic location over the long term.
The MAPI Foundation’s U.S. Manufacturing Decision Tools supports location investment decisions by aggregating key data from U.S. statistical agencies to streamline the site evaluation process. A series of maps designed to visualize county-level data will be released by the Foundation as a progressive series across the next year. The first set of interactive maps explores the current state of the manufacturing workforce. Although the outlook for U.S. manufacturing is positive, manufacturers remain concerned about their ability to find qualified workers to fill open roles and fuel their growth in a number of counties across the country.
Drug Overdose Levels
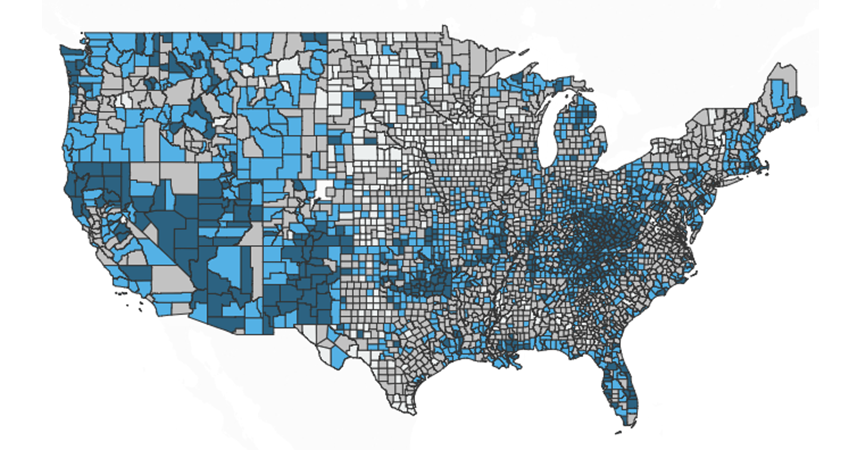
The U.S. Drug Overdose Death Rate Map provides a geographic overview of the number of drug overdose deaths per 100,000 by county. Learn more.
Education Levels
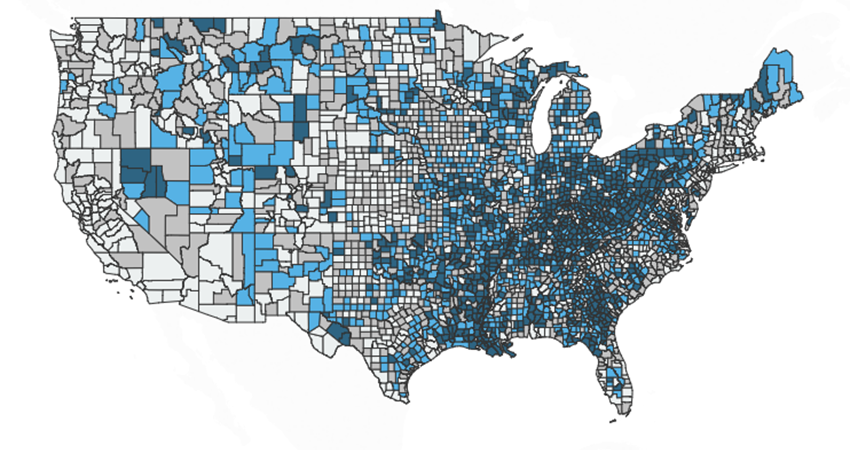
The U.S. Education Degree Map provides a geographic overview of the density of the U.S. workforce based on education attainment. Learn more.
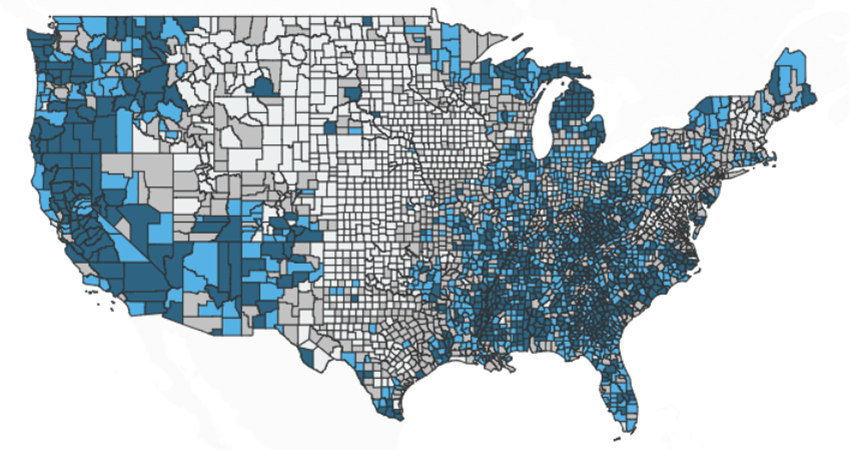
Manufacturing Employment
The U.S. Manufacturing Employment Map provides a geographic overview of the density of the U.S. manufacturing workforce in each county. Learn more.
Workforce at Prime Working Age
The U.S. Prime Working Age Map provides a geographic overview of the density of the U.S. workforce based on prime working age. Learn more.
Unemployment Rate
The U.S. Unemployment Rate Map provides a geographic overview of the density of the U.S. unemployment rate by county. Learn more.