
U.S. Industrial Outlook: Growth Acceleration Is Around the Corner
Summary of Findings and Forecasts
Manufacturing industrial production was essentially unchanged in the first quarter of 2016 and then fell at a 1% annual rate in the second quarter. July production grew at a 6% annual rate, so the third quarter is off to a good start. The strong July begs the question of whether the month’s growth was a fluke.
Both June and July had solid growth. On a month-to-month basis, manufacturing production was up 0.3% (a 4% annual rate) in June and 0.5% (a 6% annual rate) in July. The strong growth in these two months was led by the machinery, motor vehicle, and oil refining industries. The other manufacturing industries had alternating growth and decline.
The restraints to manufacturing growth have eased but have not yet been resolved:
- While there has been progress on reducing inventories, the inventory-to-sales ratio is still too high at both manufacturers and wholesalers. To pare inventories, firms have to reduce production relative to sales. In a low sales growth environment, the adjustment can cut production.
- The commodity supply chain is goods-centric. Oil prices have recently rebounded, from $33 in early February to $47 at the end of August, as the improvement in drilling profitability led to a moderate rebound in drilling rigs running in recent months from an extremely low level early in the year. Mining production is also starting to turn around. Nevertheless, agricultural prices are falling, hurting agricultural equipment investment. Very low commodity prices depress capital investment and material demand in manufacturing.
- The strong dollar has a long adjustment period. The Brexit intensified the demand for U.S. dollars and drove up an already overvalued dollar. Foreign trade will be a drag on manufacturing growth for several more years.
We expect production growth volatility will continue through the third quarter of this year and result in slow manufacturing production growth. With the inventory cutting ending soon, manufacturing should be able to string together consistent growth in the final three months of the year.
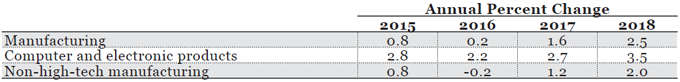
We are lowering the forecast slightly for this year because of the persistence of low commodity prices, slower than expected progress in cutting excessive inventories, and no progress on the strong dollar. We continue to believe that manufacturing production will rebound. Manufacturing production increased 0.8% last year and we forecast only 0.2% growth in 2016. We continue to expect manufacturing growth to accelerate in the coming two years but achieve only a modest pace. We forecast growth of 1.6% in 2017 and 2.5% in 2018.
High-tech production (computer and electronic products) posted 2.8% growth in 2015. We expect a small deceleration in tech production to 2.2% growth in 2016, then gains of 2.7% in 2017 and 3.5% in 2018.
Table 1 – MAPI Foundation Forecast for Manufacturing Production

Source(s): MAPI Foundation
Summary of Findings
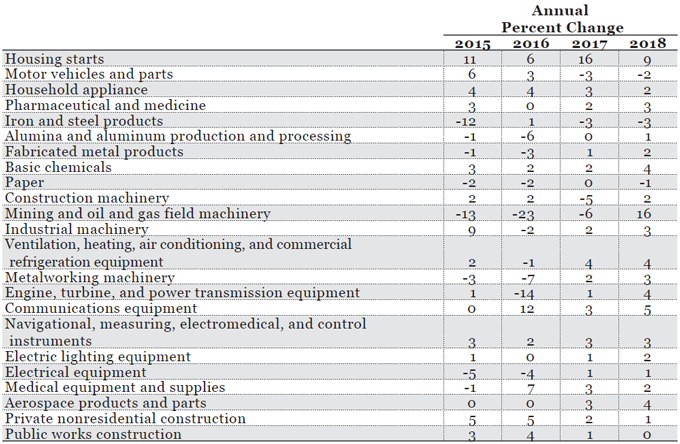
Among the highlights of this report’s cyclical analysis of 27 industries are these findings and the MAPI Foundation forecasts shown in Table 2:
- New housing starts will grow at a rapid pace in the next three years because they are at a low level relative to the pace of expected household formations. The 2016-2018 growth rates will favor single-family starts; multi-family will grow at a slower pace after many years of leading the housing recovery. The housing supply chain (wood products, nonmetallic mineral products, HVAC, household appliances, furniture, etc.) will continue to grow.
- Motor vehicles and parts production benefits from low gas prices, strong job growth, and the rising amenities in vehicles. The problem is that the pent-up demand has dissipated in the replacement cycle and age demographics are changing to the detriment of the industry. Motor vehicle and parts production should peak this year and slowly decline in 2017 and 2018.
- Private building construction will post strong growth in 2016, relative to other industries, before slowing to a modest pace during 2017-2018. Industrial construction peaked last year at an exceptionally high level and will decline in 2017 and 2018 because the surge in new motor vehicle and chemical plants is ending. Public utility construction will grow a little this year and then decline in 2017 and 2018.
- Medical care is a growth business. An aging population and the ACA are driving demand. Pharmaceutical production has stalled this year but will grow again in the United States owing to new blockbuster patent-protected products. Medical equipment and supplies production is showing strong growth in 2016 and should maintain a moderate pace in 2017-2018 even as hospitals, insurance companies, and physician practices consolidate.
- Mining and drilling exploration is currently bottoming out. The rig count will start growing again before year-end because of a modest firming in prices. With all the idle equipment, it will take time for the improvement in exploration to drive new equipment demand. Mining and drilling equipment production should fall both this year and next before posting growth in 2018.
- Total machinery production will decline 4% in 2016 and then post growth of 1% in 2017 and 3% in 2018. Agricultural, mining and drilling equipment, metalworking machinery, and engines and turbines will post major declines and drag down the total machinery category in 2016. HVAC and industrial machinery will fall only at a modest pace this year. With the exception of mining and drilling, agricultural, and construction, the other machinery categories will start recovering in 2017. Commercial and service industry machinery equipment should consistently post moderate growth over the next three years.
- A slow pace of manufacturing growth, the overvalued dollar, excess capacity in China’s manufacturing sector, and low commodity prices will significantly hurt the metals industries. Steel production will post slight growth this year after a major decline in 2015. Alumina and aluminum and fabricated metal products production should decline in 2016.
- Organic chemicals are the growth driver in the basic chemical industry. The United States’ competitive advantage in low natural gas prices—a feedstock for many chemicals—has attracted significant domestic and foreign investment in new organic chemical facilities.
- The production ramp-up in the aerospace industry remains disappointingly slow. Since most airplane deliveries are to foreign buyers, the low commodity prices, growth slowdown in emerging economies, and strong dollar have hurt deliveries, despite huge backlogs.
Table 2 – MAPI Foundation Forecasts for Manufacturing and Related Production

Source(s): MAPI Foundation
Industries in the Current Business Cycle
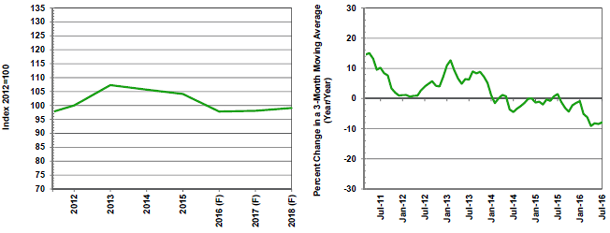
The pairs of figures for each of the 27 industries analyzed in this report show annual levels of activity and monthly rates of change. Forecasts of physical production are shown through 2018. The rate of change shown in Figures 2 through 28 is 3/12 (the year-over-year percentage change in a three-month moving average); this measure illustrates the cyclical position of each industrial sector.
Figure 1 – Industrial Sector by Phase of Cycle, July 2016
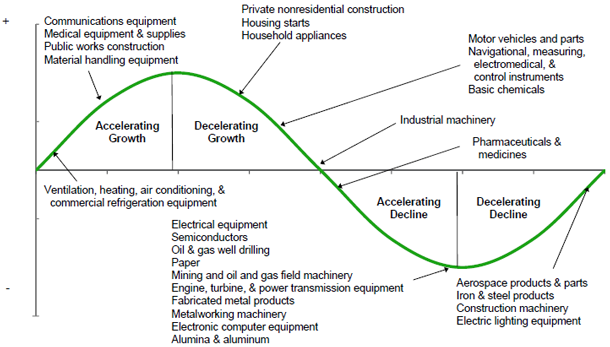

Source(s): MAPI Foundation
Individual Analysis for 27 Industrial Sectors
Highlights of inflation-adjusted business activity in selected manufacturing, drilling, and construction markets are discussed below.
Figures 2a & 2b

F=Forecast
Source(s): U.S. Bureau of the Census and MAPI Foundation
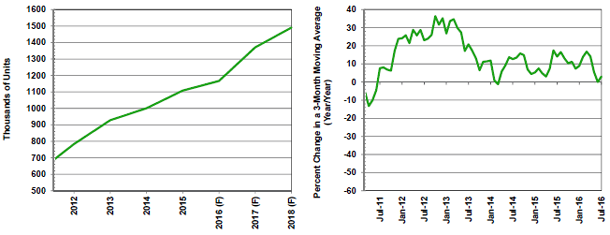
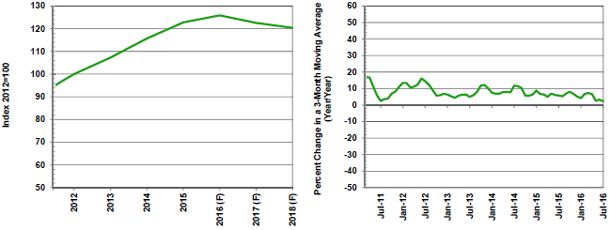
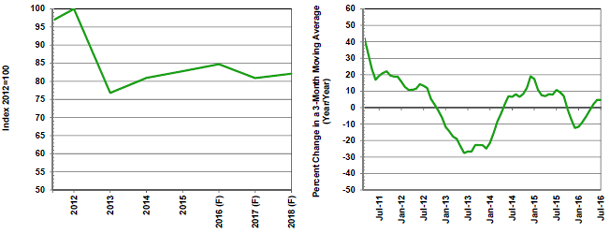
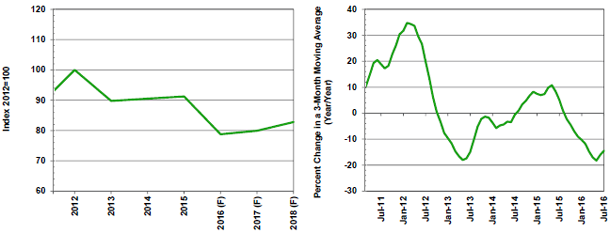
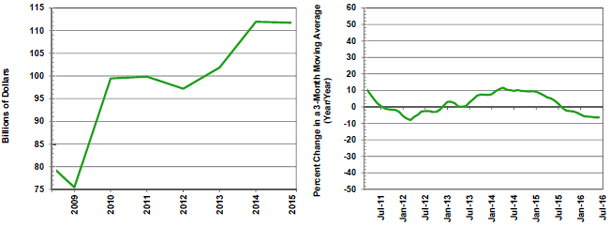
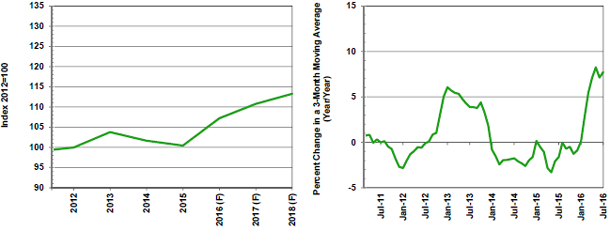
Housing starts (Figures 2a and 2b)
- The forecast is for housing start gains of 6% to 1,179,000 units in 2016, 16% to 1,366,000 units in 2017, and 9% to 1,486,000 units in 2018.
- The Case-Shiller housing price index was up 5% in the three months ending in May compared with the previous year.
- Home sales are very encouraging. In the three months ending July 2016, new single-family home sales were 22% above year-ago levels and up 51% at an annual rate from the previous three months.
- The inventory of new homes was 4.3 months of supply in July 2016, indicating tightening supply, since it is down from 5.2 months in July 2015.
- The Federal Reserve has not moved interest rates up since late last year. The weak economic growth in the United States so far this year is depressing mortgage rates. In late August, mortgage rates were 3.4%, a half percentage point below the 3.9% one year ago.
- In the end of the second quarter of 2016, the combined percentage of all mortgage loans in foreclosure or delinquent was 6.4%, down from 7.5% one year ago.
Figures 3a & 3b

F=Forecast
Source(s): Federal Reserve Board and MAPI Foundation
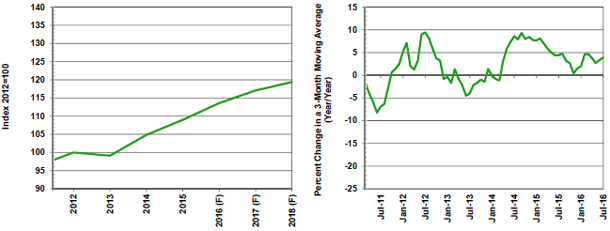
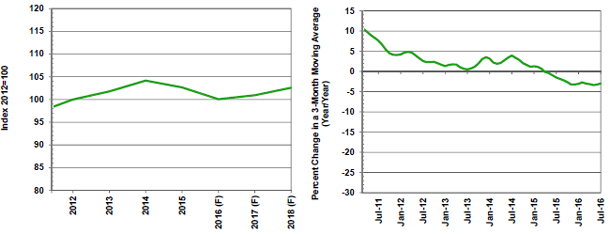
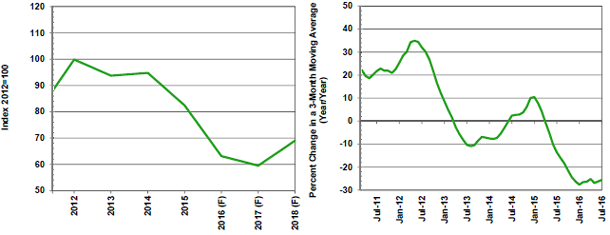
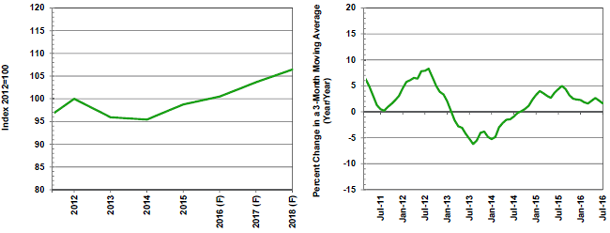
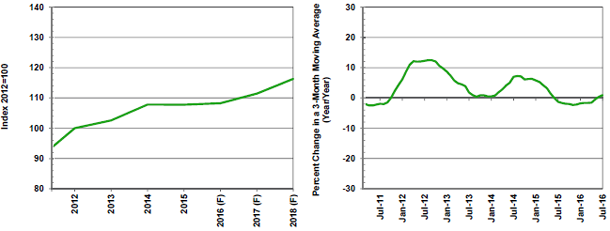
Motor vehicles and parts production (Figures 3a and 3b)
- Motor vehicles and parts production should grow 3% in 2016, fall 3% in 2017, and drop 2% in 2018. Auto and light truck sales are forecast to be 17.5 million units in 2016, 17.8 million units in 2017, and 17.7 million units in 2018.
- Overall production was up 2% in the three months ending July 2016 compared with the same period one year ago. Production declined 2% for automobiles and was up only 1% for light trucks and utility vehicles. Auto parts production increased 6% over year-ago levels.
- Heavy-duty truck production fell 13% in the three months ending July 2016 over the same period one year ago; truck trailer production dropped 8%.
- Heavy-duty truck production should decline 8% in 2016, 3% in 2017, and 1% in 2018.
- The production of campers and travel trailers rose 15% in the three months ending July 2016 over the same period one year earlier; big-ticket motor home production rose 13%.
- Motor vehicles and parts imports were up 1% while exports fell 2%. For every dollar of exports there are $2.40 of imports, so the sizable trade deficit was $1.7 billion more negative in the second quarter of 2016 compared with one year earlier.
Figures 4a & 4b

F=Forecast
Source(s): Federal Reserve Board and MAPI Foundation
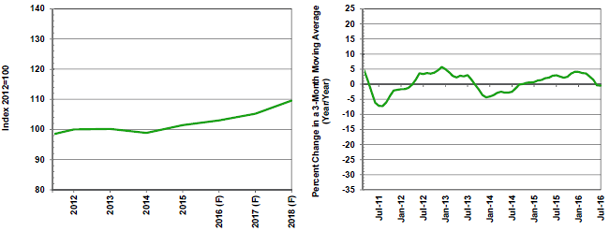
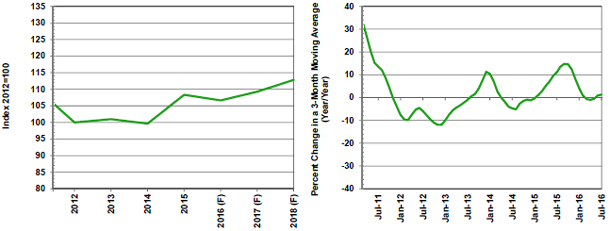
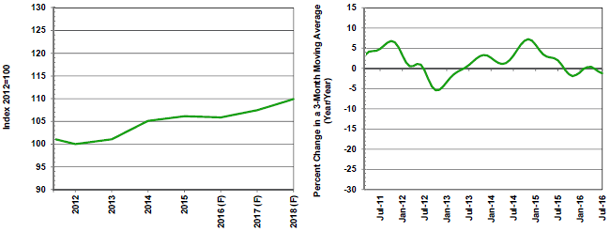
Household appliance production (Figures 4a and 4b)
- Household appliance production should grow 4% in 2016, 3% in 2017, and 2% in 2018.
- Production grew 4% in the three months ending July 2016 compared with the same period one year ago; production of small appliances was up 14% and large appliances rose 2% (the production value of major appliances is three times as large as that of small appliances). The momentum indicator, relating production from May to July 2016 to that of the previous three months, shows production rose at an 11% annual rate.
- Existing home sales rose 2% in the three months ending July 2016 from one year earlier. Both new and existing housing activity is growing versus one year ago.
- Household appliances’ import to export ratio is 6.4—one of the highest adverse trade ratios in manufacturing. Household appliance imports declined 2% and exports fell 10%, but because imports are so much larger than exports, the decline in imports left the trade deficit in the second quarter of 2016 relatively unchanged compared with one year ago.
Figures 5a & 5b

F=Forecast
Source(s): Federal Reserve Board and MAPI Foundation
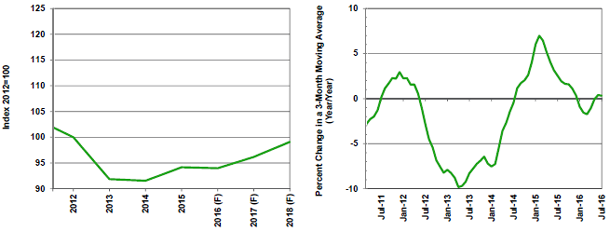
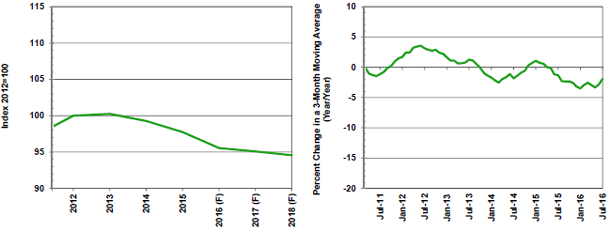
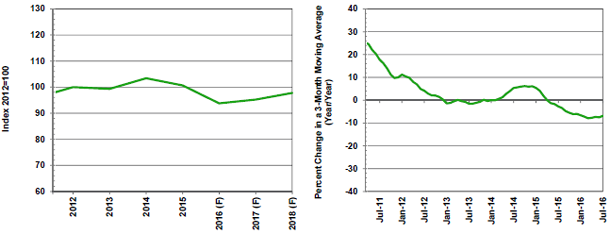
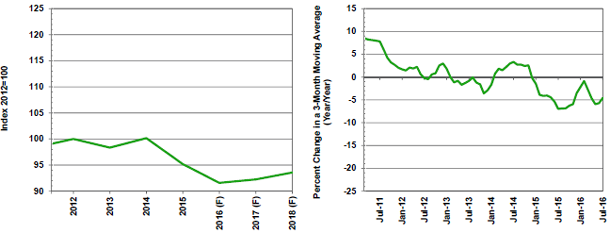
Pharmaceutical and medicine production (Figures 5a and 5b)
- Pharmaceutical and medicine production will be flat in 2016, increase 2% in 2017, and rise 3% in 2018.
- Production was unchanged in the three months ending July 2016 compared with the same period one year ago, and the recent quarter-to-quarter momentum rose at a 3% annual rate.
- Growth drivers include new product launches and new spending for innovative treatments. In addition, fewer patents are expiring than in the past few years.
- IMS Institute forecasts that the increased number and quality of new drugs for cancer, hepatitis C, autoimmune disorders, heart disease, and rare diseases will transform treatments in 2020. The strong growth of specialty drugs offsets the greater use of generics and the low growth in branded drugs.
- Employment in pharmaceuticals and medicine was up 1% in the second quarter of 2016 compared with the same period one year earlier. There was a 1% gain in pharmaceuticals and 2% growth in miscellaneous medicinal and biologicals employment.
- Pharmaceutical imports were unchanged while exports fell 1%. For every dollar of exports there are $2.10 of imports, so the already large trade deficit was $32 million more negative in the second quarter of 2016 compared with one year earlier.
Figures 6a & 6b

F=Forecast
Source(s): Federal Reserve Board and MAPI Foundation
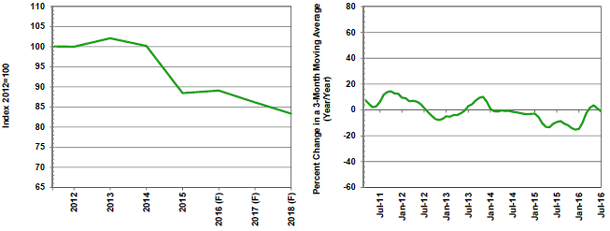
ron and steel products production (Figures 6a and 6b)
- The steel industry is predicted to increase 1% in 2016, fall 3% in 2017, and drop 3% in 2018.
- Output fell 1% in the three months ending July 2016 versus the same period one year ago. Compared with February to April, the production momentum expanded at a 7% annual rate.
- Capacity utilization in the U.S. steel industry was 71% in the week of August 20, 2022 (just under the 72% one year earlier).
- U.S. durable goods manufacturing industries’ production rose only 0.4% during May to July 2016 compared with the same period one year ago, but the quarter-to-quarter momentum was a stronger 2%. Durable goods are predominantly steel-intensive industries.
- Steel inventories are being drawn down. In July 2016, U.S. service center steel shipments decreased by 15% from July 2015. Steel product inventories also declined by 15% from the same month a year ago.
- World steel production fell 1% in the three months ending in July compared with one year ago. Steel production was down 7% in Europe (28 countries), was up 1% in Russia, and fell 5% in Korea. In the three months ending July 2016 compared with year-ago levels, China’s steel production was up 2% but Taiwan’s was down 2%. Steel production in Brazil fell 20%.
- Steel product imports fell 32% (because of trade tariffs) while exports fell 16%. Steel’s import to export ratio is 2.2, so the trade deficit was $2.4 billion less negative in the second quarter of 2016 compared with one year ago. A 6% decline in steel mill product prices for imports does not explain the decline in dollar trade in steel.
Figures 7a & 7b

F=Forecast
Source(s): Federal Reserve Board and MAPI Foundation
Alumina and aluminum production and processing (Figures 7a and 7b)
- Alumina and aluminum production is forecast to decline 6% in 2016, remain flat in 2017, and increase 1% in 2018.
- Production fell 8% in the three months ending July 2016 compared with the same period one year ago, and the quarter-to-quarter momentum was negative.
- Production in aluminum-using industries was mixed: truck trailer production fell 8%, but light truck and utility vehicle production rose 1%. Aerospace production was up only 1% from May to July 2016 compared with year-ago levels.
- The Metals Service Center Institute reported that aluminum product shipments from U.S. metals services centers fell 15% in July 2016 versus the same month one year ago.
- Alumina and aluminum production and processing imports fell 8% while exports fell 12%. Alumina and aluminum’s import to export ratio is 2.1, so the trade deficit was $61 million less negative in the second quarter of 2016 compared with one year earlier. A 13% decline in alumina and aluminum imports prices accounts for a large portion of the decline in dollar trade.
Figures 8a & 8b

F=Forecast
Source(s): Federal Reserve Board and MAPI Foundation
abricated metal products production (Figures 8a and 8b)
- Fabricated metals production should decline 3% in 2016. We expect production growth of 1% in 2017 and 2% in 2018.
- Production fell 3% in the three months ending July 2016 relative to the same period one year ago, and the quarter-to-quarter momentum was -2%.
- Production in most subindustries within fabricated metal products declined relative to one year ago. Forging and stamping was down 1%, architectural and structural metals fell 1%, and machine shop turned products and fasteners dropped 6% in the three months ending July 2016 relative to the same period one year ago. Coating, engraving, and heat treating was flat, however.
- Fabricated metal products imports dropped 5% and exports fell 7%. For every $1 of fabricated metal products’ exports there are $1.60 in imports, so the trade deficit was $149 million less negative in the second quarter of 2016 compared with one year earlier.
Figures 9a & 9b

F=Forecast
Source(s): Federal Reserve Board and MAPI Foundation
Basic chemicals production (Figures 9a and 9b)
- Basic chemicals production should post gains of 2% in 2016, 2% in 2017, and 4% in 2018.
- Overall production was unchanged in the three months ending July 2016 compared with the same period one year ago, and the quarter-to-quarter momentum was a very negative 8%.
- Petrochemical and other organic chemicals production was down 1% in the three months ending July 2016 versus one year ago. Petrochemical manufacturing includes ethylene, propylene, butylene, toluene, styrene, xylene, ethyl benzene, and cumene made from petroleum and natural gas.
- Inorganic chemicals production was up 1% in the three months ending July 2016 compared with the same period one year ago.
- A report from U.S. freight railroads indicates that chemical car loadings were up 2% in the first 33 weeks of 2016 versus the year-ago levels.
- Basic chemicals imports were down 7% while exports declined 10%. The import to export ratio is close to 1.0, so the trade surplus grew $443 million less positive in the second quarter of 2016 relative to one year earlier.
Figures 10a & 10b

F=Forecast
Source(s): Federal Reserve Board and MAPI Foundation
Paper production (Figures 10a and 10b)
- Paper production should fall 2% in 2016, be unchanged in 2017, and then fall 1% in 2018.
- Production fell 2% in the three months ending July 2016 compared with the same period one year ago. A more short-term (quarter-to-quarter) analysis reveals no production growth momentum.
- In a related end market, industrial production of food products expanded 3% in the three months ending July 2016 compared with year-ago levels.
- A report from the American Trucking Association indicated that truck tonnage did not grow in July 2016 from one year ago.
- Paper imports fell 7% while exports declined 6%. Since the import to export ratio is 0.9 (for each dollar of exports there are 90 cents of imports) in the paper industry, the trade surplus was $42 million more positive in the second quarter of 2016 compared with one year earlier.
Figures 11a & 11b

F=Forecast
Source(s): Federal Reserve Board and MAPI Foundation
Construction machinery production (Figures 11a and 11b)
- We forecast that construction machinery production will post 2% growth in 2016 before falling 5% in 2017 and growing 2% in 2018.
- U.S. production rose 5% during May to July 2016 versus the same period one year earlier. The quarter-to-quarter momentum was very strongly positive.
- It is difficult to reconcile the apparent weakness in the construction equipment market with the positive production report from the Federal Reserve. The only logical explanation is that a major manufacturer consolidated substantial production from overseas back to underutilized plants in the U.S.
- Construction equipment employment declined 7% in the three months ending June 2016 versus one year ago. Even worse, the Commerce Department reports that construction machinery orders were down 22% and shipments were off 23% in June.
- Private nonresidential construction activity expanded 3% but public works construction fell 3% in the three months ending June 2016 compared with the same period one year ago.
- Logging production dropped 1% from May to July 2016 versus one year ago.
- Mining and quarrying production fell 8% in the three months ending July 2016 compared with the same period one year ago. There was growth in precious metals mining and nonmetallic minerals and quarrying but a huge decline in coal mining.
- Construction equipment’s import to export ratio was 1.8 in the three months ending June 2016. Imports fell 14% and exports declined 25%; the trade deficit became $105 million more negative in the second quarter of 2016.
- Caterpillar reports that their North American machine deliveries to users for retail sales, adjusted for inflation, were down 20% in the three months ending July 2016 versus the same period one year earlier. Construction industries’ sales were down 14%, resources industries’ equipment fell 39%, and global energy and transportation retail sales dropped 24%.
Figures 12a & 12b

F=Forecast
Source(s): Federal Reserve Board and MAPI Foundation
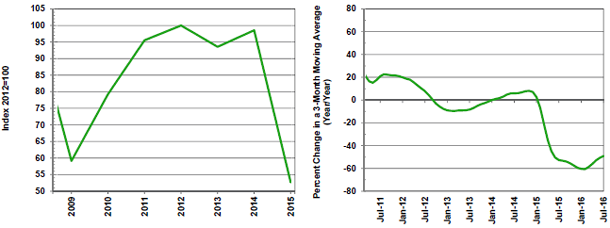
Mining and oil and gas field machinery production (Figures 12a and 12b)
- Mining and oil and gas field machinery production should fall 23% in 2016, decline 6% in 2017, then expand 16% in 2018.
- Production fell 26% in the three months ending July 2016 compared with one year earlier, and the quarter-to-quarter momentum was very negative.
- WTI oil prices were $47 at the end of August. A price of $50 is thought to be the approximate breakeven point for new shale oil drilling, so U.S. oil production is close to being generally profitable again. The Energy Information Administration (EIA) forecasts a 7% decline in U.S. crude oil production this year and a 5% decline in 2017.
- The EIA forecasts that coal production will decline 18% in 2016 and then rise 4% in 2017.
- Gold and silver mining in the United States was flat in the three months ending July 2016 compared with the same period one year earlier.
- Oil and gas well drilling fell 49% in the three months ending July 2016 compared with one year earlier. Recent momentum in the drilling market is very negative.
- Mining and oil and gas field machinery production is very export-oriented—the import to export ratio is only 0.3. Imports fell 35% while exports fell 43%; the trade surplus was $690 million less positive in the second quarter of 2016 compared with one year earlier.
Figures 13a & 13b

F=Forecast
Source(s): Federal Reserve Board and MAPI Foundation
ndustrial machinery production (Figures 13a and 13b)
- Industrial machinery is capital equipment for specific nonmetallic manufacturing industries such as woodworking, plastics, paper, textiles, printing, food products, and semiconductors.
- Industrial machinery production should fall 2% in 2016, rise 2% in 2017, and grow 3% in 2018.
- Production rose 1% in the three months ending July 2016 compared with the same period one year earlier, and the momentum indicator was very positive.
- In related sectors, wood products production rose 1%, paper production fell 2%, textile mill production fell 2%, food production increased 3%, and plastic products production fell 1% from May to July 2016 compared with the previous year.
- The Semiconductor Equipment Association reports that equipment bookings in the three months ending July 2016 were 13% higher than the same period one year earlier.
- Construction of new manufacturing plants fell 10% (in inflation-adjusted dollars) in the three months ending June 2016 from one year earlier.
- Industrial machinery imports were up 2% while exports were unchanged in the second quarter of 2016 compared with one year earlier. The industrial machinery industry is export-oriented, with a 0.8 import to export ratio. The trade surplus fell $63 million in the second quarter of 2016 relative to the same period last year.
Figures 14a & 14b

F=Forecast
Source(s): Federal Reserve Board and MAPI Foundation
Ventilation, heating, air conditioning, and commercial refrigeration equipment production (HVAC)(Figures 14a and 14b)
- The HVAC production forecast is for a 1% decline in 2016, 4% growth in 2017, and 4% gain in 2018.
- Production rose 2% in the period of May to July 2016 on a year-over-year basis, and the quarter-to-quarter momentum was very positive.
- In related industries, construction spending for home improvement fell 6% and inflation-adjusted private nonresidential construction rose 3% in the three months ending June 2016 versus one year earlier.
- Nonresidential construction related to refrigeration is declining. Inflation-adjusted food and beverage manufacturing construction fell 19% and inflation-adjusted food and beverage store construction declined 12% in the three months ending June 2016 versus one year ago.
- HVAC has an import to export ratio of 2.2. Imports were unchanged while exports declined 10% and thus the trade deficit was $195 million more negative in the second quarter of 2016 compared with one year earlier.
Figures 15a & 15b

F=Forecast
Source(s): Federal Reserve Board and MAPI Foundation
Metalworking machinery production (Figures 15a and 15b)
- Metalworking machinery consists of industrial molds; metal cutting and forming machine tools; special tools, dies, jigs, and fixtures; and miscellaneous metalworking machinery (cutting tools and rolling mill machinery).
- Metalworking machinery production should fall 7% in 2016 before rising 2% in 2017 and 3% in 2018.
- Production fell 7% in the three months ending July 2016 over year-ago levels, and the quarter-to-quarter momentum was mostly flat.
- The U.S. Census Bureau reported that metalworking machinery orders (in dollars) grew 20% in the three months ending June 2016 on a year-over-year basis.
- Metalworking machinery imports fell 10% and exports declined 10% in the second quarter of 2016 compared with one year earlier. The import to export ratio is 2.7, so the trade deficit was $269 million less negative in the second quarter of this year versus one year earlier.
Figures 16a & 16b

F=Forecast
Source(s): Federal Reserve Board and MAPI Foundation
Engine, turbine, and power transmission equipment production (Figures 16a and 16b)
- Engine, turbine, and power transmission equipment is used for freight, natural gas transmission, marine engines, and electric power.
- Our forecast for engine, turbine, and power transmission equipment production is for a 14% decline in 2016, then growth of 1% in 2017 and 4% in 2018.
- Production fell 15% in the three months ending July 2016 compared with the same period one year earlier, but the quarter-to-quarter momentum was positive (possibly indicating a bottoming out).
- Heavy-duty truck production was down 13% and the production of ships and boats fell 4% in the three months ending July 2016 over year-ago levels. The decline in marine construction, however, is not confirmed by employment in the industries—shipbuilding/repairing employment was unchanged. Boatbuilding employment gained 1% in the three months ending June 2016 compared with one year earlier. Ship and boat production is predicted to fall 6% this year, decline 5% in 2017, and drop 3% in 2018.
- Tough greenhouse gas emissions regulations and regulatory preferences for renewable energy restrain investment and new construction. However, capacity utilization for electric and gas utilities rose to a relatively high 81% in July amid a nationwide heat wave. Private electric power construction spending increased 10% in the three months ending June 2016 versus the same period one year ago.
- Turbines compress gas in pipelines and power oil and gas well drilling. Pipeline and storage construction fell 10% in the three months ending June 2016 versus the same period one year earlier. Oil and gas well drilling in the United States, however, fell 49% in the three months ending July 2016.
- The American Wind Energy Association reported that during the second quarter of 2016, 310 megawatts of wind turbines were installed—a huge decline from the 1,661 megawatts installed one year earlier. The 2.3-cent production tax credit (PTC) for wind was extended by Congress through next year. Projects that begin construction in 2017 will see a 20% reduction in the incentive each year through 2020.
- Engine, turbine, and power transmission equipment imports declined 15% and exports fell 18%. The industry has an import to export ratio near 1.0. The small $38 million trade surplus last year moved $198 million to a negative $160 million in the second quarter of 2016.
Figures 17a & 17b

Source(s): U.S. Bureau of the Census and MAPI Foundation
Material handling equipment new orders (Figures 17a and 17b)
- Material handling equipment consists of elevators, escalators, conveyors, overhead traveling cranes, hoists, industrial trucks, tractors, and trailers.
- In the three months ending June 2016, inflation-adjusted material handling shipments were up 12% compared with one year earlier.
- The construction of buildings where elevators and escalators could be used was unchanged. Inflation-adjusted construction of private and public buildings was flat in the three months ending June 2016 versus the same period one year earlier.
- Warehousing and storage employment was up 6% in the three months ending July 2016 versus the same period one year ago. The increased activity at distribution centers is likely driven by online selling. Employment of nonstore retailers was up 4% in the three months ending in July from one year ago.
- Material handling equipment imports fell 8% while exports fell 20%. The industry’s import to export ratio is 1.5, so the trade deficit turned $130 million more negative in the second quarter of 2016 from one year earlier.
Figures 18a & 18b

Source(s): U.S. Bureau of the Census and MAPI Foundation
Shipments of electronic computer equipment (Figures 18a and 18b)
- The MAPI Foundation does not forecast electronic computer equipment shipments.
- Computer shipments fell 30% in the three months ending June 2016 compared with one year earlier. Electronic computer prices declined 3%.
- Electronic computer imports fell 2% while exports dropped 5%. With a large import to export ratio of 5.3, the huge trade deficit was $226 million less negative in the second quarter of 2016 compared with one year earlier.
Figures 19a & 19b

F=Forecast
Source(s): Federal Reserve Board and MAPI Foundation
Communications equipment production and business activity (Figures 19a and 19b)
- Communications equipment encompasses telephone apparatus and broadcast and wireless communications equipment. The category also includes alarms, signaling equipment, and safety detectors.
- Communications equipment is measured by an industrial production index that adjusts activity upward to account for quality features.
- Communications equipment production should increase 12% in 2016, 3% in 2017, and 5% in 2018.
- Production rose 14% in the period of May to July 2016 compared with one year ago.
- Construction spending for communications infrastructure (in current dollars) fell 8% in the three months ending June 2016 versus one year earlier.
- Defense communications are about one-tenth of the communications equipment market; new orders (in current dollars) in this area rose 4% in the second quarter of 2016 from one year earlier. Civilian communications equipment orders declined 2%.
- Alarms, signaling equipment, and safety detectors employment declined 2% in the second quarter of 2016 from one year earlier.
- The communications equipment industry is very dependent on imports from contract manufacturing plants in Asia. With an import to export ratio of 5.8 (for every $1 of exports there are $5.80 in imports), domestic production accounts for only a small proportion of domestic consumption. Imports rose 1% while exports fell 7% in the second quarter versus one year ago. The very large trade deficit was $538 million more negative in the second quarter of 2016 compared with one year ago.
Figures 20a & 20b

Source(s): Semiconductor Industry Association and MAPI Foundation
Semiconductors (Figures 20a and 20b)
- World Semiconductor Trade Statistics, an association of semiconductor companies, collects semiconductor revenue statistics and projections. WSTS predicts a 2% decline in 2016 and 2% growth in 2017 and 2018.
- Shipments fell 6% in the three months ending June 2016 compared with one year earlier and prices fell 4%.
- Optoelectronics and sensors are the growth products in the semiconductor industry, according to WSTS. Integrated circuits (particularly memory circuits) are predicted to lead the decline in shipments.
- With an import to export ratio of 2.1, the U.S. is a net importer of semiconductors. Imports rose 4% but exports fell 1% in the second quarter of 2016; the sizable trade deficit was $868 million more negative than one year earlier.
Figures 21a & 21b

F=Forecast
Source(s): Federal Reserve Board and MAPI Foundation
Navigational, measuring, electromedical, and control instruments production (Figures 21a and 21b)
- Instrument industry production is expected to grow 2% in 2016 and 3% in both 2017 and 2018.
- Instrument production was up 2% in the three months ending July 2016 compared with one year ago.
- Search and navigation shipments (in current dollars) rose 2% in the three months ending June 2016 compared with one year ago; defense search and navigation shipments were unchanged and nondefense shipments rose 6%.
- The electromedical industry’s employment was unchanged in the second quarter of 2016 versus one year earlier. An aging population, more medical tests, and the expansion in health insurance coverage are driving this growth. Insurance companies and employers, however, are trying to hold the line on costs. Electromedical apparatus include scopes, defibrillators, EKGs, MRIs, pacemakers, ultrasounds, and many other medical testing instruments. Irradiation apparatus include CT scanners, x-ray machines, and medical radiation therapy machines.
- Industrial process instruments measure, control, or display industrial process activities such as temperature, pressure, vacuum, and viscosity. In the second quarter of 2016, industry employment fell 3% compared with one year earlier. Overall manufacturing production is relatively flat this year and there is a decline in factory machinery investment. Manufacturing plant construction is falling.
- Instruments for measuring and testing electricity and electrical signals include circuit and continuity testers, volt meters, ohm meters, watt meters, multimeters, and semiconductor test equipment. In the second quarter of 2016, industry employment was unchanged compared with one year earlier.
- Navigational, measuring, electromedical, and control instruments have an import to export ratio of 1.4. Imports declined 1% while exports fell 5%; the trade deficit was $382 million more negative in the second quarter of 2016 compared with one year earlier.
Figures 22a & 22b

F=Forecast
Source(s): Federal Reserve Board and MAPI Foundation
Electric lighting equipment production (Figures 22a and 22b)
- Electric lighting equipment includes electric lamp bulbs and residential, commercial, and industrial lighting fixtures.
- Electric lighting equipment production should be unchanged in 2016 before increasing 1% in 2017 and 2% in 2018.
- Production fell 1% in the three months ending July 2016 compared with one year ago, and the quarter-to-quarter momentum was negative.
- In related sectors, inflation-adjusted residential construction spending rose 1% in the three months ending June 2016 from year-ago levels while nonresidential construction of buildings was up 3%.
- At 7.3, electric lighting equipment’s import to export ratio is one of the most adverse in manufacturing. Imports were unchanged while exports fell 9% in the second quarter of 2016 compared with one year earlier. The trade deficit was $50 million more negative than one year earlier.
Figures 23a & 23b

F=Forecast
Source(s): Federal Reserve Board and MAPI Foundation
Electrical equipment production (Figures 23a and 23b)
- This sector consists of transformers, motors and generators, switchgear, relays, and industrial controls.
- The forecast calls for electrical equipment production to decline 4% in 2016 and then rise 1% in both 2017 and 2018.
- Production was down 5% in the three months ending July 2016 compared with one year ago, with more negative momentum.
- The factory operating rate was 75.4% in July 2016, down 0.4% from one year ago and below the long-term average of 78.5%.
- Relay and industrial controls production appears to be declining. Employment in the industry was down 1% in the second quarter of 2016 relative to one year earlier. Manufacturing construction activity fell 10% when adjusted for inflation.
- Electric motors and generators provide power for many machinery and transportation applications, while generators convert motion into electricity for residential, utility, and industrial uses. Second quarter employment in the industry was down 4%.
- Transformers and power distribution equipment tend to follow electric utility construction, the creation of new communities, and a replacement cycle; housing starts were up 3% in the three months ending July 2016. Electric power construction spending rose 10% and employment in the transformer industry was up a strong 3% in the second quarter of 2016 compared with one year earlier.
- Switchgear and switchboard apparatus production is likely declining. Industry employment was flat in the second quarter of 2016 compared to a year ago.
- Electrical equipment imports were up 2% while exports fell 16%. The industry’s import to export ratio is 2.3, so the weakness of exports pushed the trade deficit $744 million more negative in the second quarter of 2016 compared with one year ago.
Figures 24a & 24b

F=Forecast
Source(s): Federal Reserve Board and MAPI Foundatio
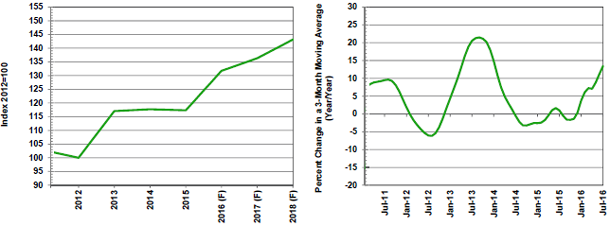
Medical equipment and supplies production (Figures 24a and 24b)
- This category encompasses surgical and medical instruments, surgical appliances and supplies, and dental laboratories.
- We forecast medical equipment production growth of 7% in 2016, 3% in 2017, and 2% in 2018.
- Production increased 8% in the three months ending July 2016 compared with year-ago levels.
- Surgical and medical instruments employment increased 2% in the second quarter but surgical appliances and supplies employment fell 1%.
- Safety equipment and supplies and the “all other” group that includes lab equipment and hospital furniture, dental equipment and supplies, and vision care goods experienced a 1% decline in employment in the second quarter of 2016.
- Dental laboratories industry employment rose 1% in the three months ending June 2016.
- Medical equipment and supplies imports increased 6% while exports fell 3%. With an import to export ratio of 1.3, the strong growth in imports pushed the trade deficit $697 million more negative in the second quarter of 2016 compared with one year earlier.
Figures 25a & 25b

F=Forecast
Source(s): Federal Reserve Board and MAPI Foundation
Aerospace products and parts production (Figures 25a and 25b)
- Aerospace products and parts production will be unchanged in 2016, grow 3% in 2017, and rise 4% in 2018.
- In the three months ending July 2016, production increased 1% compared with one year ago; there was positive momentum from the previous three months.
- Boeing reported 152 net orders for new commercial airplanes in the second quarter of 2016 and delivered 199 (up 1% from a year earlier). Boeing delivered 762 commercial airplanes in 2015 and expects 743 deliveries in 2016, a 2% reduction.
- U.S. airline traffic—measured in revenue passenger miles—rose 4% in the three months ending May 2016 versus one year earlier.
- Defense aerospace contracts are very long term and military austerity likely longer term. Defense aerospace shipments (in current dollars)—about one-third of the total industry—were down 18% in the three months ending June 2016 versus one year earlier. Civilian aircraft and parts shipments fell 3% in this time frame.
- With an import to export ratio of 0.4, aerospace is the largest net exporter in U.S. manufacturing. Imports fell 2% while exports were up 5% in the second quarter of 2016. The trade surplus was $1.7 billion more positive relative to one year earlier.
Figures 26a & 26b

Source(s): Federal Reserve Board and MAPI Foundation
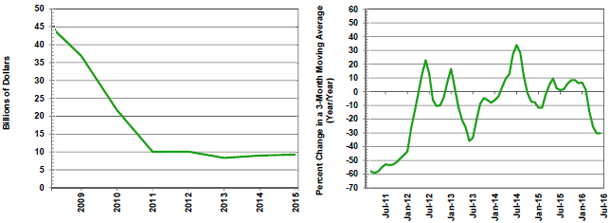
Oil and gas well drilling production (Figures 26a and 26b)
- The MAPI Foundation does not forecast drilling production.
- Drilling activity declined 49% in the three months ending July 2016 relative to one year ago and has sizable negative momentum.
- Brent oil improved from $34 per barrel in late February to $47 at the end of August. The EIA forecasts a 7% decline in U.S. crude oil production this year and a 5% decline in 2017.
- Henry Hub natural gas rose from $1.78 per million cubic feet in late February 2016 to $2.75 in late August. Natural gas production is forecast to increase 1% in 2016 and 3% next year.
- Baker Hughes reports that 83% of operating U.S. rigs looked for oil in August. The U.S. rig count for oil drilling was down 41% in August 2016 versus the same four-week period one year ago. The U.S. rig count for natural gas drilling was down 61% in the same period. In a more recent comparison, the rig count appears to have bottomed out. There were about 405 rigs running in May; by August, the rig count was up to about 480.
Figures 27a & 27b

F=Forecast
Source(s): U.S. Bureau of the Census and MAPI Foundation
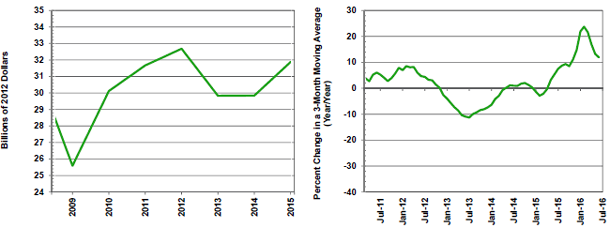
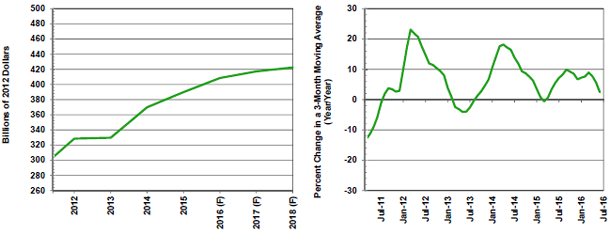
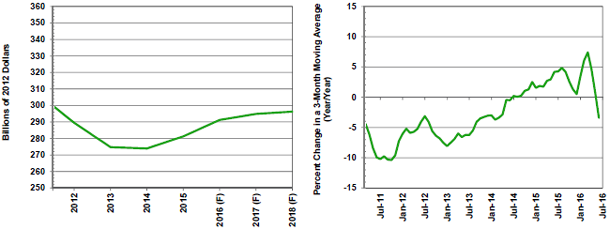
Private nonresidential construction put-in-place (Figures 27a and 27b)
- Inflation-adjusted nonresidential spending should increase 5% in 2016, 2% in 2017, and 1% in 2018.
- Nonresidential construction was up 3% in the three months ending June 2016 versus year-ago levels.
- There was very strong construction growth in lodging (hotels), office buildings, and amusement and recreation in the three months ending June 2016. Moderate growth occurred in private education, commercial, religious, transportation, and power.
- A large decline in construction activity occurred in communication, manufacturing, natural gas and oil pipelines, and storage in the second quarter.
- Construction spending for factories, adjusted for inflation, was down 10% during April to June 2016 from one year earlier. The strongest growth was in fabricated metal products and plastics and rubber. Small changes occurred in transportation equipment and chemicals. Food and beverages, nonmetallic minerals, and computers, electronics, and electrical posted large declines. We forecast industrial construction spending to experience declines of 7% in 2016, 5% in 2017, and 3% in 2018.
- Private electric power construction should expand 3% this year, be unchanged in 2017, and fall 4% in 2018 because of potential greenhouse gas emissions regulations.
- The architectural and engineering firm billing index—a leading indicator—signaled a decline in January but then rebounded, showing modest growth in activity for February through July 2016. An employment indicator supports this growth premise. Architectural and engineering employment was up 2% in the three months ending July 2016 versus one year ago.
Figures 28a & 28b
F=Forecast
Source(s): U.S. Bureau of the Census and MAPI Foundation
Public construction put-in-place (Figures 28a and 28b)
- Construction spending by federal, state, and local governments is primarily directed toward schools, highways, sewers, dams, waterworks, and various public buildings.
- Inflation-adjusted public construction spending is forecast to increase 4% in 2016, rise 1% in 2017, and be unchanged in 2018.
- Public works construction was down 3% in the three months ending June 2016 compared with the same period one year ago, and the quarter-to-quarter momentum was very negative.
- In the last three months, modest growth was achieved by public education construction and conservation and development.
- Moderate declines in public construction spending were seen in healthcare, public safety, amusement and recreation, and highway and street.
- Large declines in public construction spending were evident for office buildings, transportation, power, sewerage and waste disposal, and water supply.
- State and local government receipts from taxes and federal transfers will be up 2% in 2016 and 5% in 2017 and 2018. A modest pace of economic expansion will generate higher personal tax receipts and property and sales taxes.