
Automation Investment in U.S. Manufacturing: An Empirical Picture
Sponsored by Rockwell Automation
Executive Summary
Amid all of the recent public dialogue about new manufacturing technologies and manufacturing automation investment in particular, there are little or no data offering a coherent picture of the automation investment dynamic. In this second of three MAPI Foundation papers on manufacturing productivity performance, I seek to remedy the data deficit by presenting the results of a national survey of U.S. manufacturers on their automation activity. I offer revealing stratifications of the results by company size and industry.
Major findings include:
- The incidence of actual and planned automation investment is very high in the U.S. manufacturing sector. The high incidence spans across company size and industry cohorts.
- The most prevalent of a wide range of criteria used by survey respondents to evaluate the performance of new automation technologies is whether they lower total production costs, evidence that increased global manufacturing integration is raising the pressure for automation investment as cost competition looms ever larger as a U.S. manufacturing company operating incentive.
- The survey shows that both costs and product quality are pressured, a difficult problem even in the context of lean supply chains, as quality escalation can add to the cost of production. For any manufacturer, particularly a larger one with significant global exposure, this likely means that the initial automation implementation is just the beginning of a journey. Automation will be an ongoing concern and part of a broader complex of evolutionary, and in some cases revolutionary, operating changes.
- Those that have recently engaged in or plan to engage in automation as a stand-alone investment are likely at the beginning of this post-lean automation adoption journey, while those that have automated and/or plan to automate as part of a broader effort with company technological infrastructure are likely further along in their technological transformations. Given the split in the respondent pool along these lines, it seems that there is currently a wide range of advancements along the technology adaptation curve in the U.S. manufacturing population.
- The survey reveals a remarkably high incidence of automation in the cohort of very small manufacturers that likely comes from supply chain pressures and can be said to be further evidence of the spreading of automation suggested by the fact that customer, supplier, and competitor use were noted by respondents as primary drivers of automation investment.
- By allowing for efficiencies in at least some kinds of production, the supply of new automation capital makes it easier for manufacturing entrepreneurs to overcome the often significant barriers to entry in goods-producing markets and for marginal small manufacturing companies that might otherwise have exited the market to stay and compete.
- While external forces are catalyzing widespread automation activity in U.S. manufacturing, internal company concerns are acting as something of a break. As the survey shows, labor force issues are among the potential impediments. Human capital challenges, including the difficulty of finding and retaining computer-literate production workers, certainly show themselves to be a cost of automation if nothing else because they slow the full implementation of automation capital into the goods-producing process. But given the overwhelming incidence of automation investment, both planned and actual, in our national survey of manufacturing companies that span a wide range of company sizes and industries, it seems clear that cost and performance pressures are by and large trumping workforce and other internal impediments in the automation decision function.
- If smaller companies that are holding out on automation investment because of cost considerations continue to do so, they will be at a competitive disadvantage in any supply chain that affects their current or future profitability.
- While stratifications do not reveal an industry bias in automation investment per se, stratifications by share of companies that engaged in automation investment as part of a broader effort with their technology did reveal a distinctly higher incidence in computers and transportation equipment, two of the relatively higher-productivity subsectors.
Abstract
A national survey of U.S. manufacturers and non-U.S. manufacturers with at least one production presence in the U.S. was conducted during the second week of December 2015. Questions were designed to gather data on the prevalence of actual and planned automation investment, the drivers of and impediments to automation investment, and the criteria for evaluating new automation technologies. Other questions included the relationship of new automation investment to broader company technological infrastructure, whether automation technology implementation is generally a broader upgrade of automation or a complete asset base upgrade, and whether automation capital is implemented slowly and in stages or as fast as the new technology will allow. Post-survey stratifications were conducted by company size and industry.
The results show a high incidence of actual and planned automation investment in U.S. manufacturing, both in total and spanning a wide range of company size groupings and industries. Data on the drivers of investment and the company evaluation criteria for assessing the benefits of new automation capital suggest a possible spreading effect across supply chains and industries as the need for globally competitive production costs and product quality becomes increasingly intense. There was a split in the respondent pool between companies that engaged in and plan to engage in automation implementation as a stand-alone investment versus those that automated or will automate as a broader effort with company technological infrastructure, with the latter having a higher incidence in smaller company cohorts.
Section 1
Introduction: Competitive Stress, Demographic Constraint, and Automation Investment
This is the second installment of a three-part MAPI Foundation research series on manufacturing productivity performance. In the first paper, I used industry-level data to consider the broad U.S. productivity evolution of recent decades and then revealed the results of a statistical analysis that was intended to identify and quantify the macro drivers of manufacturing productivity growth on an industry level. The research exposed a worrisome outlook and suggested that a coordinated policy program aimed at stimulating a turnaround in the labor force participation rate of those with a B.A. degree and higher as well as strengthening and broadening manufacturing equipment investment and innovation output is needed for a brighter productivity picture.
While such a program is certainly challenging, the study found that cross-sector linkages in productivity determination would mean that well-placed investments in one industry will reap beneficial impacts on productivity performance in other industries. Happily, the encouraging news extends even further. As noted in the first paper, we are living in something of a paradoxical time for manufacturing performance. While the productivity path is certainly of concern, the factory sector is, at the same time, confronting a period of remarkable technological disruption. On an almost daily basis, news stories appear about seemingly strange and interesting new technologies that will expand the capacities of the manufacturing sector and could fundamentally change the nature of manufacturing itself. While technological advance is a consistent feature of history, it has not been a linear progression. There are periods where disruptions are more rapid and widespread than others. The current period qualifies as one of dramatic advancement that will likely yield fundamental process innovations.
Two forces are playing a role in the dynamism of the current period. The first is quite simply the growing intensity of global manufacturing competition. The advancing integration of heavily populated low-labor-cost countries into the global trading network and the ever-tightening connection between the manufacturing sectors of key countries, through not only ever more complex supply chains but also innovation spillovers and trade channels, has intensified cost pressures and performance pressures.
U.S.-based manufacturers began to address such challenges in the 1990s with the implementation of lean manufacturing, a new production paradigm adopted from the Toyota of the 1990s and the Ford Motor Company of the early part of the 20th century. But the lean journey set only the framework for change that is now moving to a second stage with new technology and a new vision for what a factory looks like, how it operates, and what it actually does.
The second motivator takes the form of a host of demographic shifts that have been taking place across the world. Population growth and labor force growth are slowing not just in the advanced economies but also now in many emerging market nations. Key countries in the developed and developing world are feeling the pressure of lower births, declining labor force shares of their total populations, and a swelling retirement cohort. There are powerful exceptions, most notably India and most of the African continent, but for much of the world labor is becoming an increasingly scarce input for production.
With intensified competition on cost and performance and slowing labor supply growth, it is certainly reasonable to predict that technology innovators will see increased demand for the output of their long-simmering innovations as manufacturers have a growing incentive to make the most effective use of these promising new tools that they possibly can. But with all the public dialogue about new manufacturing technologies and manufacturing automation investment in particular, little or no data offer a coherent picture of the automation investment dynamic. How much automation investment has there been? What are the short-term drivers? What is the outlook for automation investment?
In this second paper, I seek to remedy the automation data deficit by presenting the results of a national survey of U.S. manufacturers on their automation activity. In doing so, I reveal the results for the broad population of U.S.-based manufacturers and non-U.S. manufacturers with at least one U.S. production presence and offer stratifications by company size and industry.
In Section 2, I explain the construction of the survey questionnaire. Section 3 presents the results for the full population of respondents. Section 4 shows stratifications of the results by company and industry cohort. Section 5 offers analysis of the evolving automation dynamic painted by the results and Section 6 places the survey in the broader context of the manufacturing productivity path. Section 7 offers suggestions for further research. In the appendix, I discuss the survey method.
Section 2
Survey Questionnaire
My survey effort focused on basic questions:
- How widespread has automation investment been in U.S. manufacturing?
- To the extent that there has been the implementation of new automation capital in U.S. manufacturing production processes, what has motivated it?
- Is automation generally a stand-alone investment or does it tend to coordinate with broad changes in manufacturing company technological infrastructure?
- How does company size impact automation investment?
- Are there large differences in automation investment among major manufacturing subsectors?
- For the purpose of understanding the forward dynamic of automation investment, insights are needed on how manufacturers evaluate their new automation technology and what their automation investment plans are for the near-term future.
The definition of “automation” was a key questionnaire construction issue. Because I was interested in obtaining a broad picture of automation behavior, I did not ask about the respondents’ decision or experience with any specific automation technology but rather about automation investment in general. I asked: “During the past five years, has your company purchased and/or implemented one or more technologies that you have not used before, either for your U.S. or non-U.S. operations, whose purpose was to newly automate any aspect of your product-producing process through labor enhancement, labor substitution, or both?”
Section 3
Automation Investment Is Widespread in U.S. Manufacturing
Automation investment is widespread in the U.S. manufacturing sector and among those non-U.S. manufacturers that have at least one production presence in the United States. As shown in Figure 1, 83% of respondents to our national survey indicated that they engaged in some kind of automation investment in the five years preceding this December 2015 survey. And more than three-quarters, 76%, indicated that they plan to engage in automation investment during the subsequent three years.
Figure 1 – Percent Who Engaged in Automation Investment in the Prior 5 Years and Who Plan to Engage in Automation Investment in the Coming 3 Years
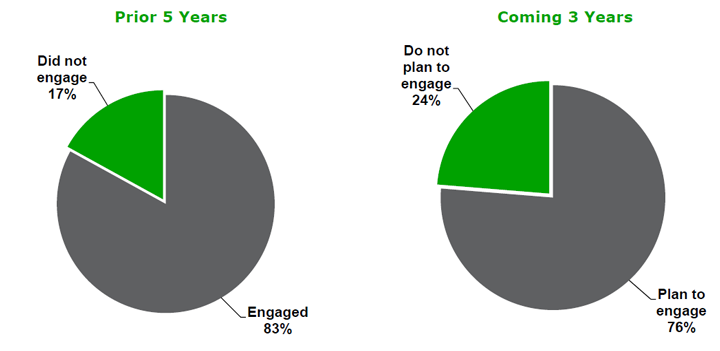

Source(s): MAPI Foundation
There was an interesting split between those respondents who indicated that their actual or planned automation investment activity was a stand-alone investment versus those who noted that it was a part of a broader upgrade of their companies’ technological infrastructure. As shown in Figure 2, just short of half, 45%, indicated that their automation investment of the past five years was part of a broader technology upgrade, while 35% indicated that it was a stand-alone investment. A not insignificant proportion (20%) indicated that they engaged in both, with instances of isolated automation investment and instances where automation was part of a larger effort with company technology.
The split for planned automation is similar, with 35% of respondents who plan on engaging in automation investment in the three years following the survey indicating that it will be a stand-alone investment, 41% indicating that it will be a part of a broader effort with company technology, and nearly one-quarter, 24%, indicating that they will engage in both (Figure 2).
Figure 2 – Percent Whose Automation Investment Was or Will Be a Stand-Alone Investment Versus a Broader Upgrade of Company Technology Infrastructure
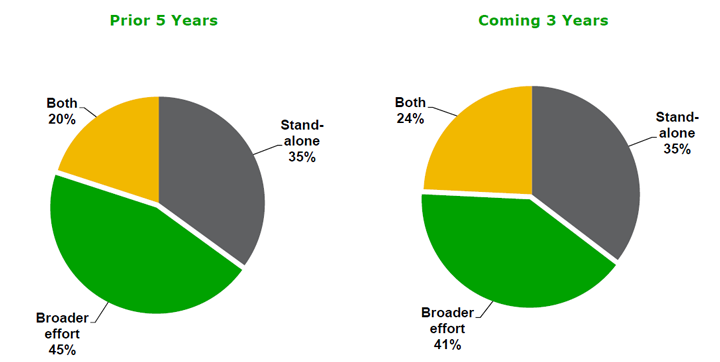

Source(s): MAPI Foundation
Figure 3 shows that slightly more than three-quarters, 76%, of respondents who plan on engaging in automation investment during the next three years noted that it will be a broader upgrade of automation, versus 24% who plan on engaging in a complete asset base upgrade.
Figure 3 – Percent Whose Automation Investment of the Next 3 Years Will Be a Broader Upgrade of Automation Versus a Complete Asset Base Upgrade

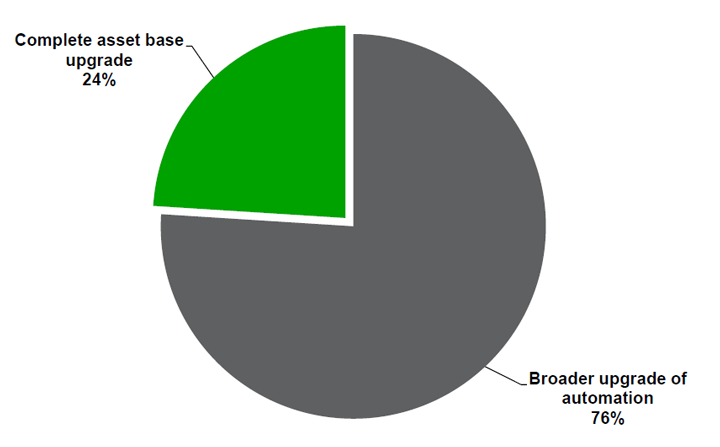
Source(s): MAPI Foundation
Motivated by growing recognition that the adoption of new capital can be as significant a part of the cost of technological implementation as the purchase of capital,1 I asked respondents who engaged in automation investment during the five years prior to the survey about the pace of implementation. As shown in Figure 4, a narrow majority, 54%, indicated that they implemented their new automation technologies of the past five years slowly and in stages versus 46% who implemented their new automation technologies as rapidly as the technology will allow. While not shown, the data indicate a firm size sensitivity, with smaller company cohorts having a larger incidence of implementing new automation technologies slowly and in stages.
Figure 4 – Pace of Automation Technology Implementation in the Prior 5 Years

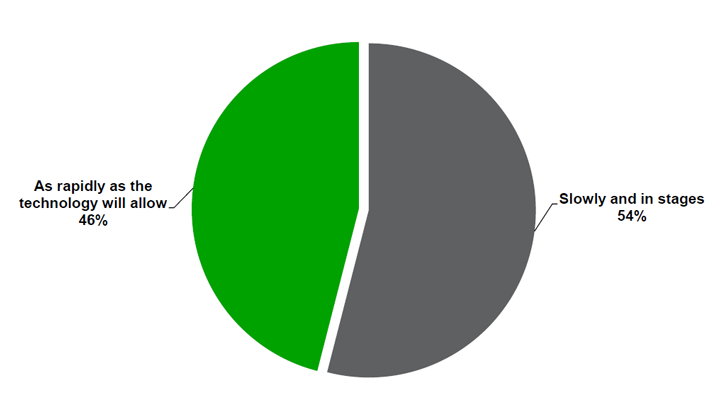
Source(s): MAPI Foundation
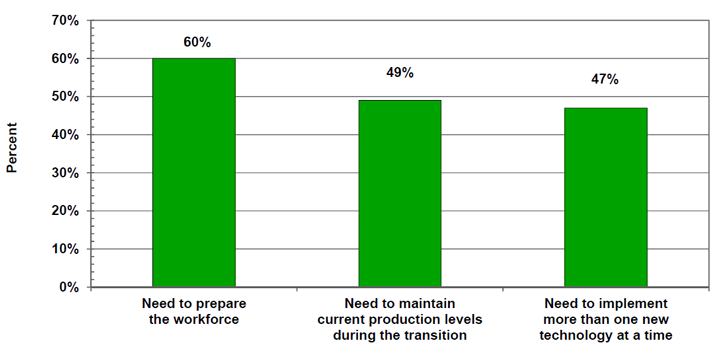
For those respondents who implemented their new automation technology slowly, I asked why. As shown in Figure 5, the dominant reason was the need to prepare the workforce, spotlighting the broad effort that is involved in company technology shifts. Respondents also noted that the need to implement more than one technology at a time and the need to maintain current production levels during the transition were important reasons for the slow pace.
Figure 5 – Primary Reasons for the Slow Pace of Automation Technology Implementation in the Prior 5 Years

Source(s): MAPI Foundation
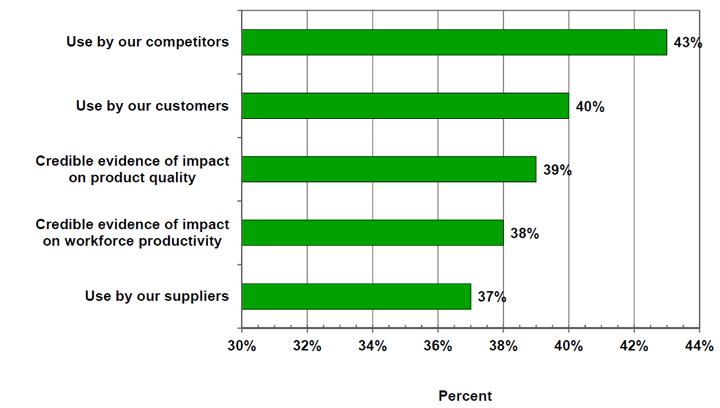
Figure 6 shows the top five motivators for the 83% of respondents who engaged in automation investment in the five-year period prior to the survey. There seems to be something of a supply chain and industry impact, as three of the top five concerned use by the respondents’ competitors, customers, and suppliers. Evidence of impact on product quality was also a top five driver, an underappreciated aspect of the manufacturing automation story.
Figure 6 – Top 5 Drivers of Automation Investment in the Prior 5 Years

Source(s): MAPI Foundation
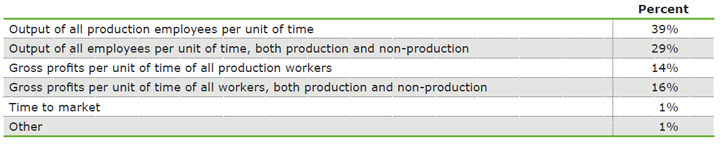
With evidence of impact on workforce productivity also being a key driver, I asked respondents who cited this motivator to tell us how their companies measure productivity. As shown in Table 1, output metrics are dominant, with 39% measuring output of all production employees per unit of time and 29% measuring output of all employees, both production and non-production, per unit of time. A smaller share rely on a profits measure, with 14% using gross profits per unit of time of all production workers and 16% using gross profits per unit of time of all workers, production and non-production.
Table 1 – Distribution of Productivity Metrics Used by Respondents Who Indicated That Workforce Productivity Improvement Was a Driver of Automation Investment in the Prior 5 Years

Source(s): MAPI Foundation
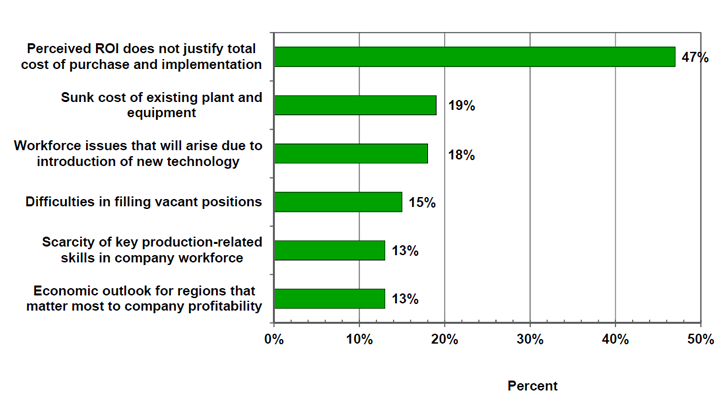
What can stand in the way of automation investment? To further flesh out the incentive picture, I asked respondents who did not engage in automation investment in the five years prior to the survey why they did not automate. Figure 7 presents the top six reasons. As shown, it was overwhelmingly a matter of cost–benefit analysis, evidenced by the 47% indicating that the perceived return on investment (ROI) did not justify the total cost of purchase and implementation. Other reasons included stranded costs, workforce issues, and the economic outlook, which does not appear to be a big motivator for automation investment but is slightly more impactful as an impediment. (The third report in this series will examine how companies should measure ROI on new technology investments and will discuss the most effective ROI metrics for evaluating the implementation of largely untested technologies.)
Figure 7 – Top 6 Reasons for Not Engaging in Automation Investment During the Prior 5 Years

Source(s): MAPI Foundation
The future flow of automation investment will depend in part on how manufacturers view the performance of their new automation capital. To that end, I asked about elements of consideration in new automation technology performance evaluation. As shown in Figure 8, the top two performance criteria are the lowering of total production costs and the improvement of product quality. Shortening time to market, shortening supply chains, and meeting explicit ROI requirements are also important considerations. While time to market was used as a measure of company productivity by only 1% of respondents who indicated that workforce productivity improvement was a driver of automation investment in the five years prior to the survey, it was nonetheless revealed as an important criteria for evaluating the performance of new automation technology.
Figure 8 – Top 5 Criteria for Evaluating the Performance of New Automation Technology

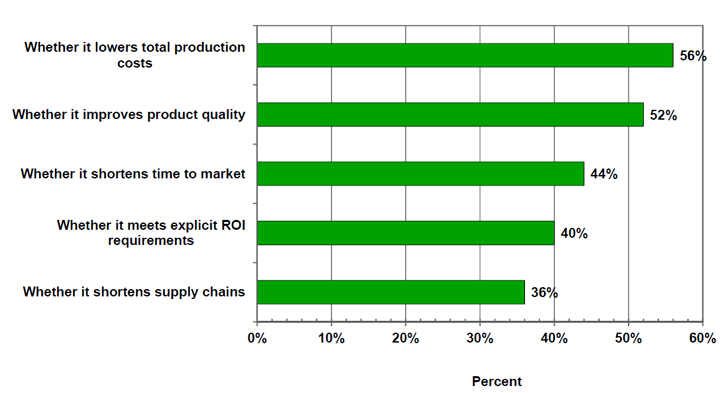
Source(s): MAPI Foundation
Section 4
Breaking it Down by Company Size and Industries
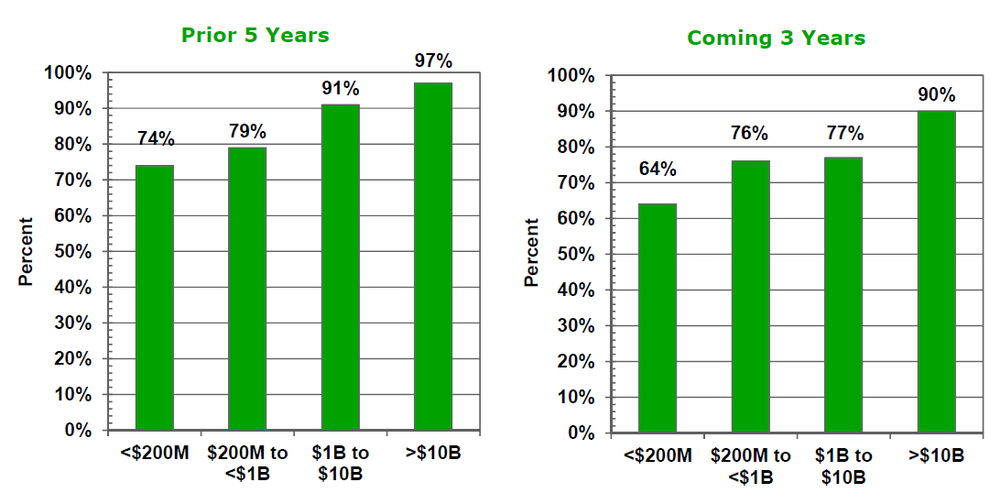
With a diverse population in the respondent pool, company size and industry stratifications add much to analysis of the results. Figure 9 stratifies actual and planned automation by company size cohort. The incidence of automation activity is revealed to be an increasing function of size. As shown, 74% of the responding population in the smallest size cohort (average annual global sales revenues of less than $200 million for the past three fiscal years) engaged in automation investment activity in the five years prior to the survey. Within this cohort, 64% noted that they plan to automate in the three years following the survey. On the other extreme, 97% of respondents in the largest size cohort (revenues greater than $10 billion) engaged in automation investment activity in the prior five years and 90% plan to automate some aspect of their product-producing process in the following three years.
Figure 9 – Share by Size Cohort of Respondents Who Have Engaged in Automation Investment During the Past 5 Years and Plan to Do So During the Next 3 Years

Source(s): MAPI Foundation
Given that company size creates scale economies that produce high returns on automation investment, it is notable how prevalent automation has been within very small company size cohorts. This raises a number of interesting questions for further research, including whether innovation in the automation space has been creating incentives for entrepreneurship in manufacturing.
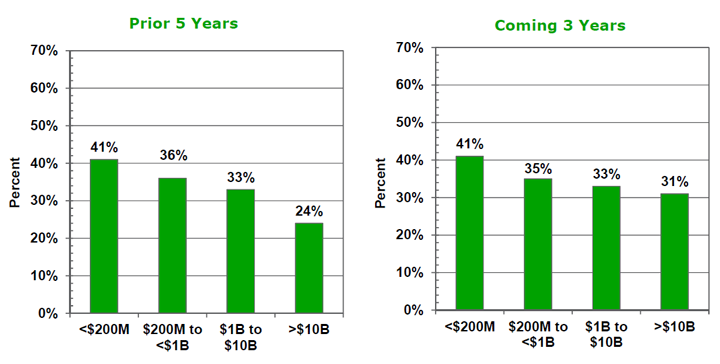
The opposite relationship is true when looking at company size cohort stratifications of those respondents who indicated that automation was part of a broader effort with their companies’ technology. As shown in Figure 10, 41% of automating respondents in the smallest size cohort indicated that their automation investment in the five years prior to the survey was a component of a broader effort with their companies’ technological infrastructure as compared with 24% in the largest size cohort. For planned investment, 41% of the smallest size cohort indicated that their companies’ automation investment of the next three years will be part of a broader effort with their companies’ technology versus 31% in the largest size cohort.
Figure 10 – Share Within Size Cohorts of Survey Respondents Whose Automation Investment Was Part of a Broader Effort With Their Company’s Technology and Will be Part of a Broader Effort With Their Company’s Technology

Source(s): MAPI Foundation
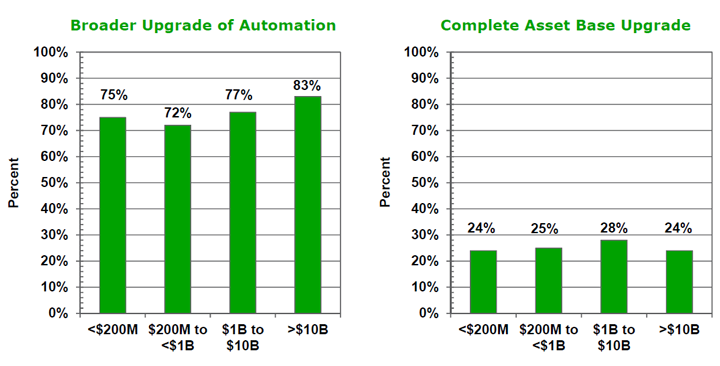
Figure 11 shows the incidence by size cohort of those respondents who indicated that their automation investment of the next three years will be part of a broader upgrade of automation versus a complete asset base upgrade. As per the relationship of this question to company size, the data are somewhat less smooth than for the previous two comparisons; however, at 83%, the greater than $10 billion size cohort does have the greatest share of respondents who indicated that their automation activity will be a broader upgrade of automation.
Figure 11 – Share Within Size Cohorts of Survey Respondents Whose Automation Investment During the Coming 3 Years Will be Part of a Broader Upgrade of Automation Versus a Complete Asset Base Upgrade
Source(s): MAPI Foundation
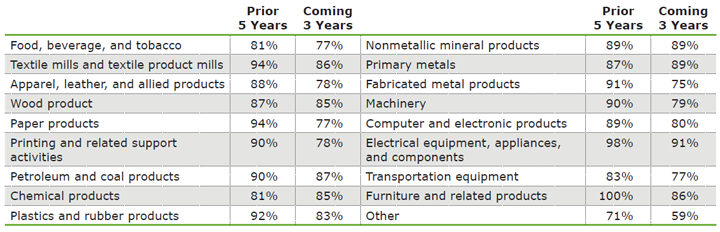
Stratifications of actual and planned automation investment by major manufacturing subsectors are shown in Table 2. While statistically speaking there are not dramatic differences among most industries, it is clear that electrical equipment, paper products, and textile mills have been the strongest industries for actual automation activity in the five-year period prior to the survey. The 100% in furniture needs to be viewed with skepticism because of the small number of respondents from this industry.
Table 2 – Share Within Industry Cohorts of Respondents Who Engaged in Automation Investment During the Prior Five Years and Who Plan to Engage in Automation Investment During the Coming Three Years

Source(s): MAPI Foundation
Chemical products, nonmetallic mineral products, and primary metals are the only industries whose incidence of planned automation activity for the three years following the survey was either equal to or greater than the share that engaged in actual automation activity in the five prior years. The remaining industries are seeing a drop-off from the incidence of actual to planned investment, but not a large drop-off by any means.
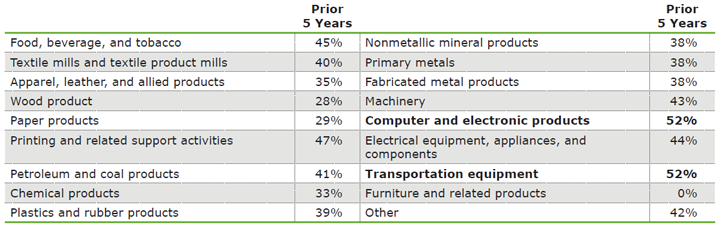
Table 3 shows the share by industry cohort of respondents whose automation investment during the past five years was part of a broader effort with their companies’ technology. Larger differences among industries are noted when compared to industry stratifications of actual and planned investment activity. Computers and transportation equipment had the largest share of respondents who indicated that their automation investment was part of a broader effort, as opposed to being a stand-alone investment. As revealed in the first paper in the MAPI Foundation productivity research series, these are industries that rank relatively high within the manufacturing sector for their productivity performance.
Table 3 – Share Within Industry Cohorts of Respondents Whose Automation Investment During the Prior Five Years Was Part of a Broader Effort With Their Company’s Technological Infrastructure

Source(s): MAPI Foundation
Section 5
Survey Data Paint an Evolving Picture of the Automation Dynamic
The fact that the most prevalent of a wide range of criteria used by respondents to evaluate the performance of new automation technologies is whether they lower total production costs can be taken as clear evidence that increased global manufacturing integration is raising the pressure for automation investment as cost competition looms ever larger as a U.S. manufacturing company operating incentive. Both costs and product quality are pressured, a difficult problem even in the context of lean supply chains, as quality escalation can add to the cost of production. For any manufacturer, particularly a larger one with significant global exposure, this likely means that the initial automation implementation is just the beginning of the journey. Automation will be an ongoing concern and part of a broader complex of evolutionary, and in some cases revolutionary, operating changes.
Those who have recently engaged in or plan to engage in automation as a stand-alone investment are likely at the beginning of this post-lean automation adoption journey, while those who have automated and/or plan to automate as part of a broader effort with company technological infrastructure are likely further along in their technological transformations. Given the split in the respondent pool along these lines, it seems that there is currently a wide range of advancements along the technology adaptation curve in the U.S. manufacturing population.
It is understandable that a somewhat higher share of smaller companies are automating as part of a broader effort with technology given that they are likely suppliers to larger companies whose technological and competitive paradigms are well established. More generally, the remarkably high incidence of automation in the cohort of very small manufacturers likely comes from supply chain pressures and can be said to be further evidence of the spreading of automation suggested by the fact that customer, supplier, and competitor use were noted by respondents as primary drivers of investment. By allowing for efficiencies in at least some kinds of production, the supply of new automation capital makes it easier for manufacturing entrepreneurs to overcome the often significant barriers to entry in goods-producing markets and for marginal small manufacturing companies that might otherwise have exited the market to stay and compete.
While these external pressures are catalyzing widespread automation activity in U.S. manufacturing, internal company concerns might very well be countervailing forces. As the survey shows, labor force issues are among the potential impediments. Human capital challenges, including the difficulty of finding and retaining computer-literate production workers, certainly show themselves to be a cost of automation if nothing else because they slow the full implementation of automation capital into the goods-producing process. But given the overwhelming incidence of automation investment, both planned and actual, in our national survey of manufacturing companies that span a wide range of company sizes and industries, it seems clear that cost and performance pressures are by and large trumping workforce and other internal company impediments in the automation decision function. Much of the U.S. manufacturing sector appears to be finding ways of making the necessary labor force adaptations to automation investment—or at least believes that they eventually will.
Section 6
What Do the Survey Data Suggest About the Relationship Between Automation and Productivity in the Manufacturing Sector?
Automation implementation is a hybrid, exhibiting characteristics of both capital investment and innovation investment. In the sense of deploying machinery into a production line, it has characteristics of capital equipment investment. But it does not appear to be as short-term oriented as capital investment. While further study is needed, automation does not appear to be an element of business expansion. Rather, it is more like process innovation whose principal goals are cost reduction and product quality improvement.
It will take time for the relationship between automation investment and productivity performance to be clarified. Our national survey shows that the implementation of automation capital is often slow, partially to allow for a workforce adjustment. The survey for the current report comes at a time when rampant automation with the current generation of emerging technologies is really a new phenomenon. In a sense, the current period is analogous to the computerization fad of the 1990s, although with the complicating difference of great heterogeneity, given the growing list of automation technologies.
While automation investment appears widespread in U.S. manufacturing, the holdouts are represented by the 17% of survey respondents who did not engage in some form of automation activity in the five years prior to the survey. Survey data and stratifications suggest that these are most likely smaller companies. And the basic problem seems to be clearing return on investment (ROI) analysis. This is somewhat understandable; adjustment costs to new technologies, including workforce pressures of various kinds and stranded costs, are especially difficult for smaller companies. But the rapid spreading of automation makes the case beyond cost. If these companies do not engage in automation investments in tandem with their customers, suppliers, and competitors, they are going to find themselves at a competitive disadvantage in almost any supply chain of importance or potential importance to their profitability.
Stratifications in the current survey do not reveal an industry bias in automation investment. Automation activity appears to be widespread across industries—not the high-productivity industries and not the low-productivity industries but across all industries. Such a relationship, even if there were one, would be ambiguous. It is certainly conceivable that the weaker-productivity sectors could have the higher incidence of automation investment. However, in conducting industry stratifications by share of companies that engaged in automation investment as part of a broader effort with their technology, I found that computers and transportation equipment had a distinctly higher incidence. These are two of the higher-productivity sectors, perhaps highlighting the value of a strategic approach to process innovation.
A fuller and perhaps more satisfying answer to the question of the automation/productivity relationship could come from examining more complex conceptual structures highlighted in this report as well as in the first paper in this series. The first paper presented evidence of productivity interconnectedness between and among major manufacturing subsectors, where productivity performance in one subsector has impacts on productivity performance in other subsectors through such linkages as supply chains, trade channels, clusters, and innovation spillovers. In this paper, I noted the possibility of network effects for automation investment, where such investments are spreading merely because of the pressures of use by suppliers, customers, and competitors. It is plausible to suggest that network effects in automation investment can strengthen productivity interconnectedness among major subsectors. This would be valuable to consider and observe over time.
Whatever the final answer on the automation/productivity relationship, the results in the first paper show that automation is not a full solution to weak productivity. The backdrop of strong capital investment, innovation output, and educated labor are critical ingredients to changing the path of productivity performance.
Section 7
Further Research
Beyond the basic question of the relationship between automation investment and productivity, two issues should motivate further research. The first is how manufacturing companies should go about making new technology investment decisions, which they face with greater and greater frequency. The standard ROI framework seems increasingly thin given that new technologies often leave stranded costs upon implementation and require, as our survey data show, lengthy implementation adjustments. This question will frame the third paper in the MAPI Foundation productivity series.
Second, many questions follow from our observation of a high incidence of actual and planned automation investment in small manufacturing concerns. Is automation creating an incentive for manufacturing entrepreneurship? Does accelerated innovation of new automation technology have the potential to spawn new manufacturing companies? Research on these questions will open a new dimension of the productivity discussion.
Appendix
Survey Execution and Characteristics of the Responding Population
During the second week of December 2015, our online questionnaire facilitated a national survey of U.S. manufacturers with a production presence in the U.S. as well as non-U.S. manufacturers with at least one production presence in the United States. The latter accounted for only 7% of the responding population. For the purposes of the survey, “manufacturers” are defined as companies that produce one or more products that are sold for profit.
Further screening was done on the respondents’ level of involvement with their companies’ automation investment decisions. If the respondent indicated that they have “little or no input or decision making authority in the area of automation investment,” they were dropped from the responding pool. I obtained a total of 402 qualified/completed survey responses. Of the 966 disqualifications, all but 198 resulted from attempts to respond to the survey after I reached my completion quota.
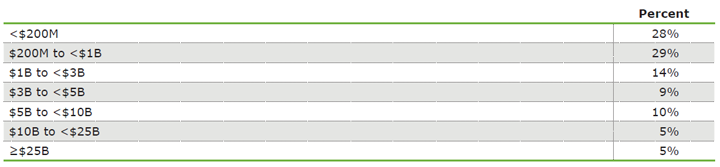
Tables A1 through A4 display key characteristics of the responding population. Table A1 shows the distribution of respondents by company size. Reflecting the reality of all sectors of the U.S. economy, the distribution is heavily weighted toward smaller companies, with 57% having less than $1 billion in average annual global sales revenues during the prior three fiscal years. Nonetheless, with 20% of responding companies having $5 billion or greater in average annual global sales revenue, there is sufficient size spread in the response pool to reasonably examine the role of company size in population automation behavior.
Table A1 – Distribution of Survey Respondents by Size (Average Annual Global Sales Revenue for the Prior Three Fiscal Years)

Source(s): MAPI Foundation
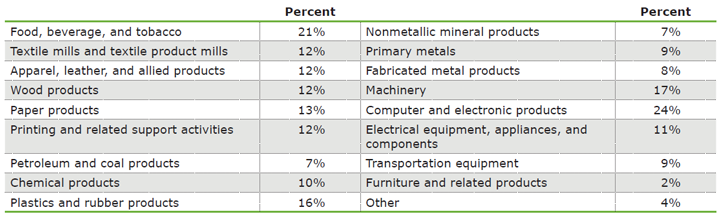
Table A2 shows the distribution of respondents by industry. While 45% of respondents are in the food and computer subsectors, the distribution of respondents by key industries, with the exception of furniture, is adequate for considering survey responses by subsector cohort.2
Table A2 – Distribution of Respondents by Industry

Source(s): MAPI Foundation
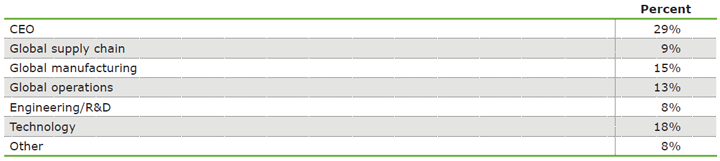
Table A3 shows the distribution of respondents by area of company; I asked for the term that most accurately describes the respondents’ roles. One advantage of having a large group of smaller companies in the responding pool is that chief executive officers are often the ones who are responding. As shown, 29% of respondents are CEOs.
Table A3 – Distribution of Respondents by Area of Company

Source(s): MAPI Foundation
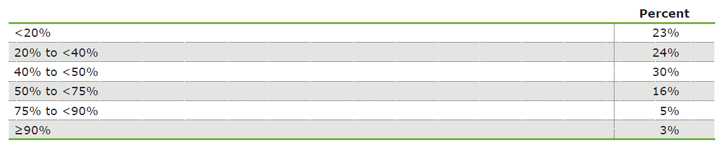
Finally, Table A4 shows the distribution of respondents by their companies’ shares of average operating revenue generated from outside of their U.S. operations during the past three fiscal years. As shown, more than half of responding companies, 54%, earned 20% or greater but less than 50% of their revenues from their operations outside of U.S. borders. Nearly one-quarter, 24%, earned 50% of their revenues or greater from non-U.S. sources. The survey pool clearly has a range of global exposure.
Table A4 – Distribution of Respondents by Share of Operating Revenue From Operations Outside of the U.S. (Average of the Prior Three Fiscal Years)

Source(s): MAPI Foundation
1. See for example, Diego Comin and Bart Hobijn, “Implementing Technology,” NBER Working Paper No. 12886, February 2007.
2. Many respondents work for companies that are in multiple manufacturing industries.